
What is Microsoft Defender EASM?
Microsoft Defender External Attack Surface Management (EASM) is a distinct Azure security solution that adopts the perspective of an external attacker to continuously map and monitor digital assets exposed on the Internet. Unlike internal vulnerability management tools, EASM operates from outside your network perimeter and requires no agent deployment on your systems.
Monitored asset categories include:
- Exposed websites and applications
- Public IP addresses
- Domain names
- SSL/TLS certificates
- Other digital footprints associated with your organization
The solution can also forward its logs to SIEMs like Microsoft Sentinel, enabling you to enrich your correlation rules and automation playbooks.
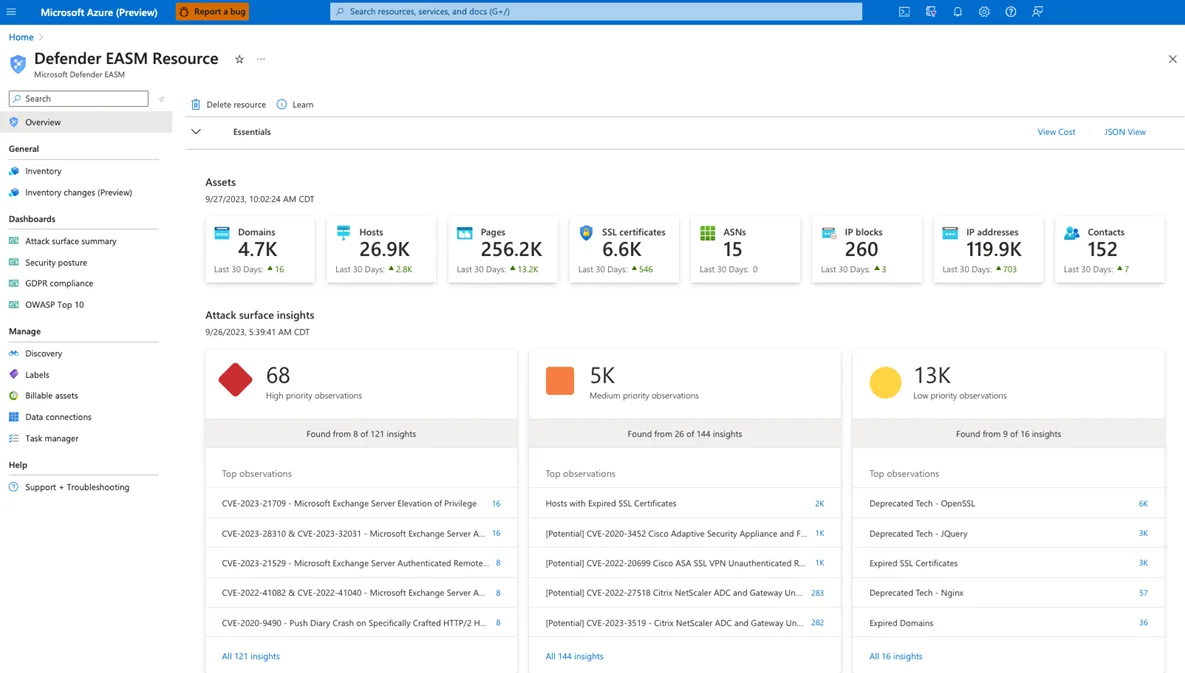
Key Features and Cost Model
Detection Capabilities
Here are the controls that Defender EASM continuously executes on your assets:
- Open port scanning on each inventoried IP address
- SSL/TLS certificate monitoring with expiration alerts
- Domain name verification and expiration date tracking
- Correlation with known CVEs and associated scoring
- Detection of common administrative misconfigurations
- Web server assessment according to OWASP recommendations
- Temporal tracking of asset changes (port addition/removal, certificate rotation…)
- 30-day free trial with no billing
Pricing
The billing model is straightforward: €0.01 per day per host, domain, or IP address added to the inventory. Billing is processed through your existing Azure subscription.
For reference, a deployment with 10 instances of each resource type generates monthly spending of approximately €9.17. This cost-to-value ratio is particularly advantageous compared to market EASM solutions.
Trial Period
The first 30 days are free, giving you time to evaluate actual coverage before validating the budget. However, verify that your Azure subscription has sufficient quota to deploy the resource in the target region.
Prerequisites and Minimum Permissions
Before starting the deployment, ensure you have:
- An active Azure subscription with access to portal.azure.com
- The Contributor role (or higher) on the target resource group — the Reader role alone is insufficient to create the resource
- Access to the resource provider
Microsoft.Easmregistered on the subscription (verification below) - If you want Sentinel integration: Microsoft Sentinel Contributor role on the target Log Analytics workspace
Verify and register the provider from Azure CLI or PowerShell:
1# Check provider status2Get-AzResourceProvider -ProviderNamespace Microsoft.Easm | Select-Object RegistrationState3 4# If RegistrationState = 'NotRegistered', register it5Register-AzResourceProvider -ProviderNamespace Microsoft.EasmRegistration propagation can take 2 to 5 minutes. Rerun the first command to confirm that RegistrationState has changed to Registered.
Step 1 — Deploy the Defender EASM Workspace
Access the resource in the Azure portal
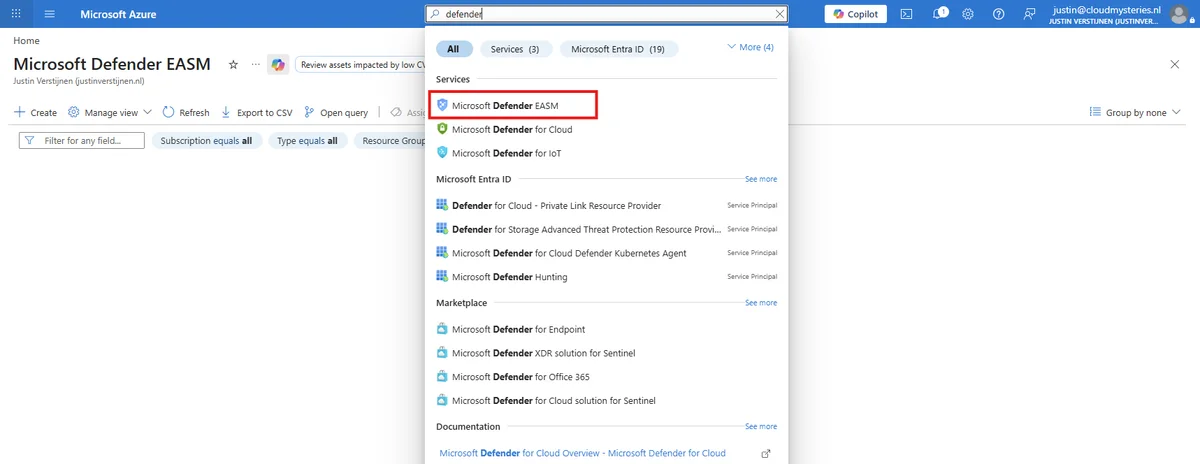
Sign in to the Azure portal and search for Defender EASM in the global search bar. Select the service from the results.
Create a new workspace
Click + Create to launch the creation wizard. Fill in the following fields:
- Subscription: your target subscription
- Resource group: dedicated resource group (recommended:
rg-easm-prod) - Name: letters and numbers only, no spaces or hyphens
- Region: choose the region closest to your primary assets
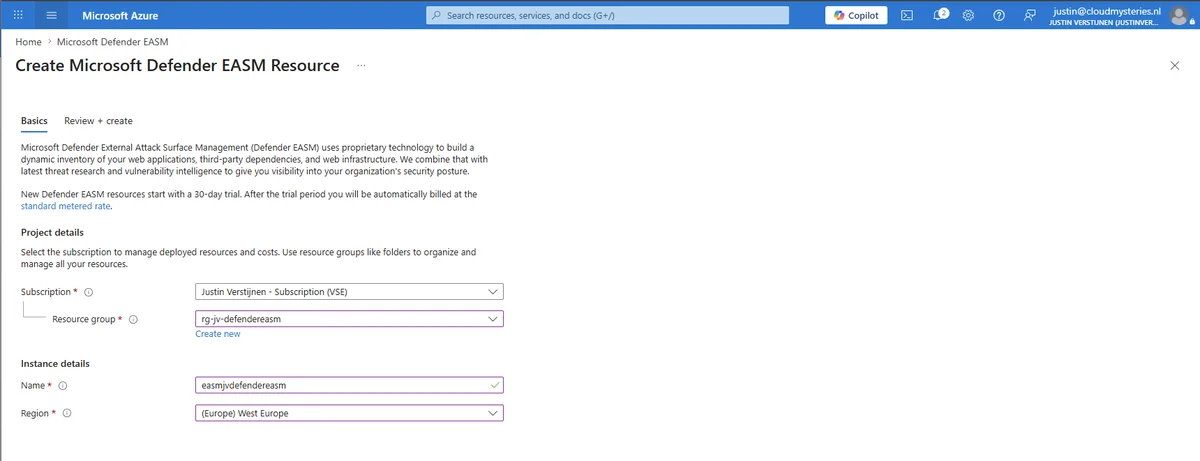
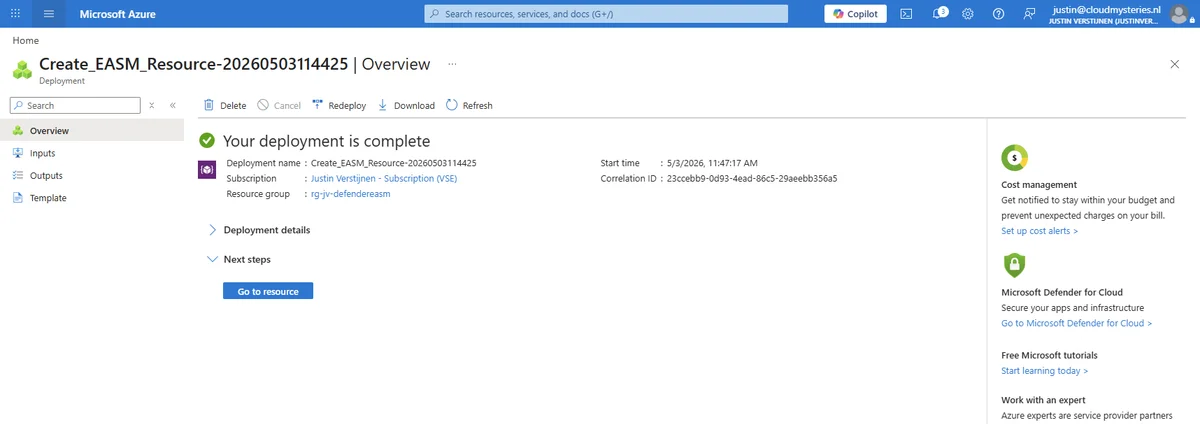
Validate with Review + Create, then Create. Deployment typically takes less than a minute.
Step 2 — Populate the EASM Inventory
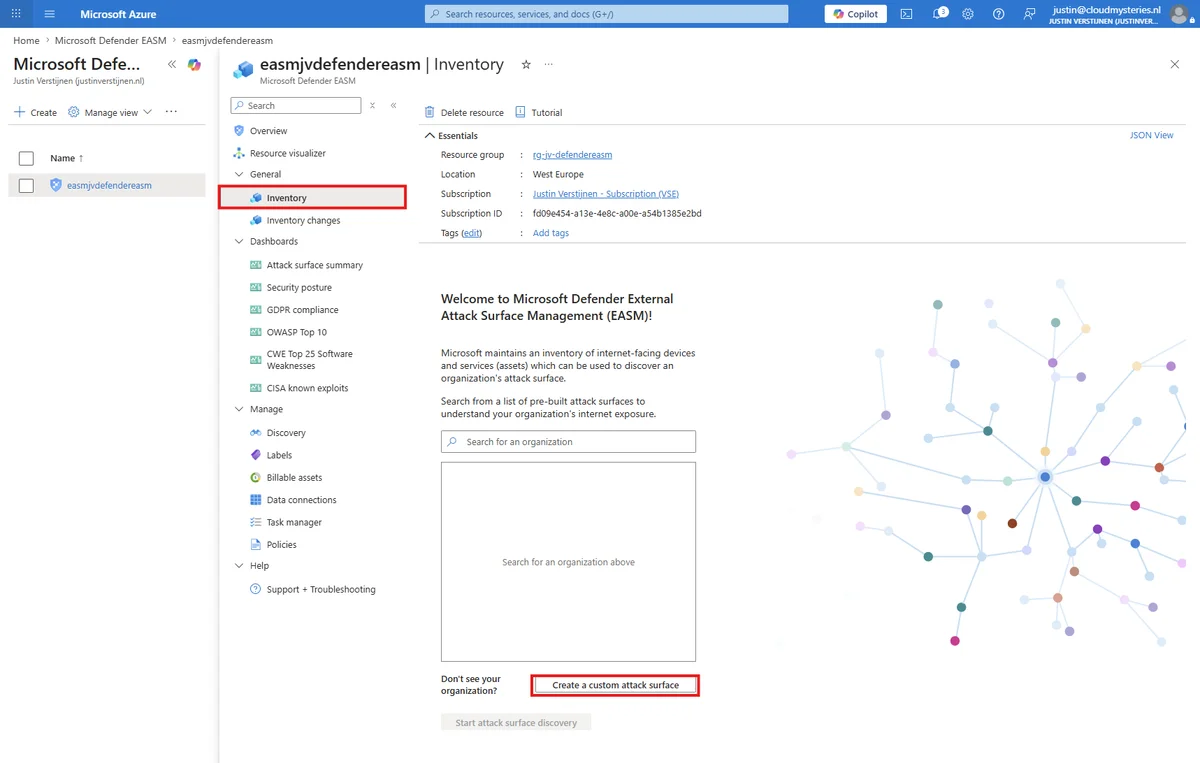
Once the workspace is available, navigate to the Inventory panel to add your assets. Two modes exist:
- Automatic discovery: EASM starts from a list of seeds (root domains, WHOIS IP ranges, organization names) and explores the exposed perimeter through inference.
- Manual entry: you precisely control what is scanned.
For this article, we use manual entry. Click Create a custom attack surface and enter your assets (domains, IP addresses, email addresses, CIDR blocks).
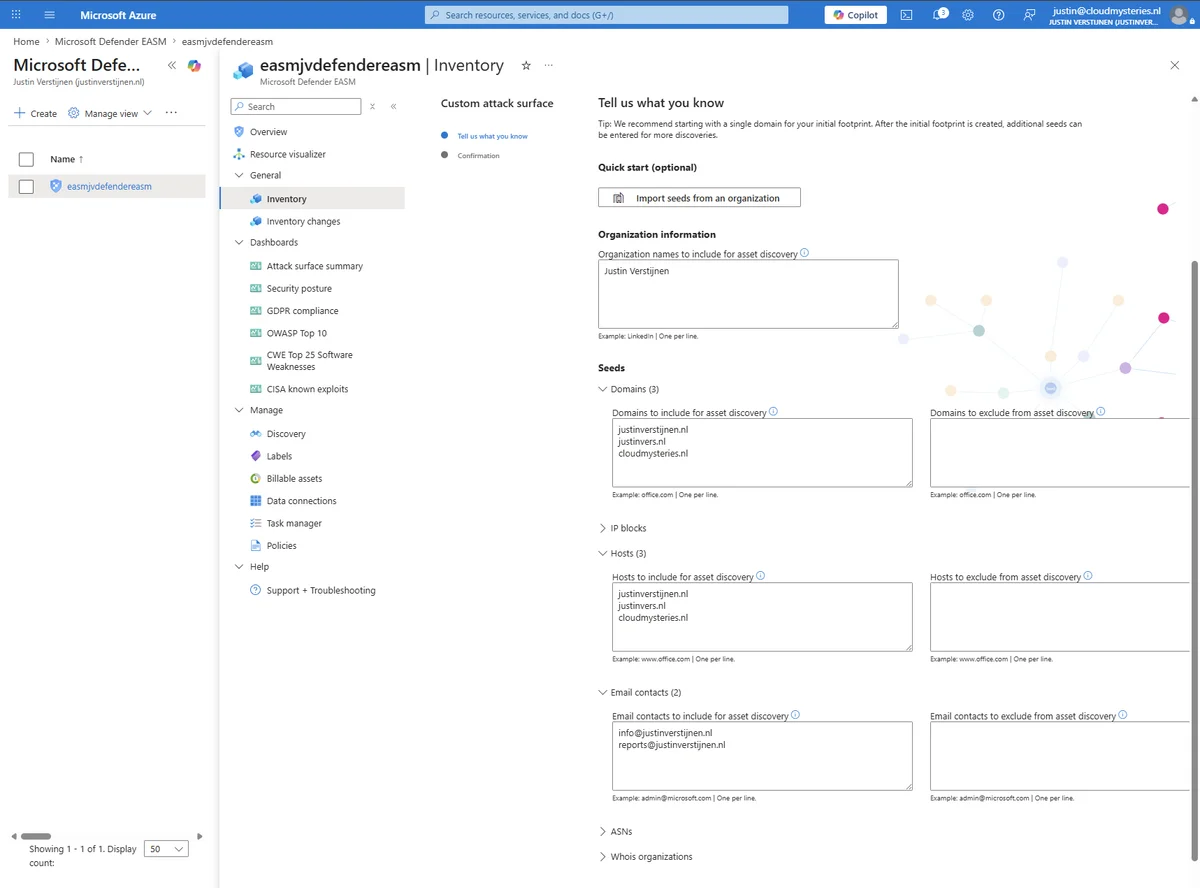
No Bulk Import
Currently, the interface does not provide CSV or API import functionality for initial inventory. Each asset must be entered individually. For environments with hundreds of entries, prioritize automatic discovery from representative seeds.
Once the list is complete, click Confirm. The initial scan starts automatically.
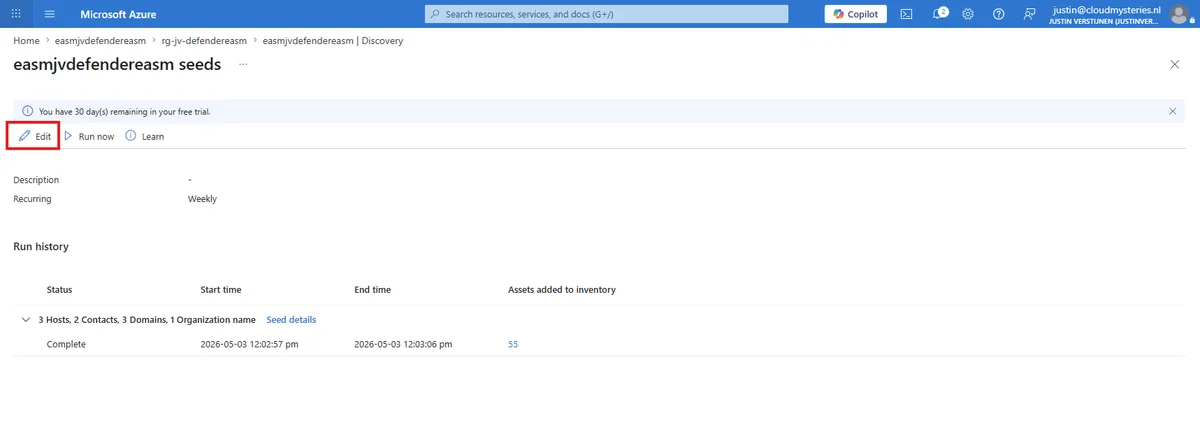
Propagation delay: the initial scan can take up to 48 hours to complete. In practice, first results often appear within 5 to 15 minutes for the simplest assets (DNS resolution, certificate status).
Step 3 — Check Asset Status and Interpret the Dashboard
Once the scan is ongoing or complete, the workspace home page displays a consolidated view of discovered assets and their security status.
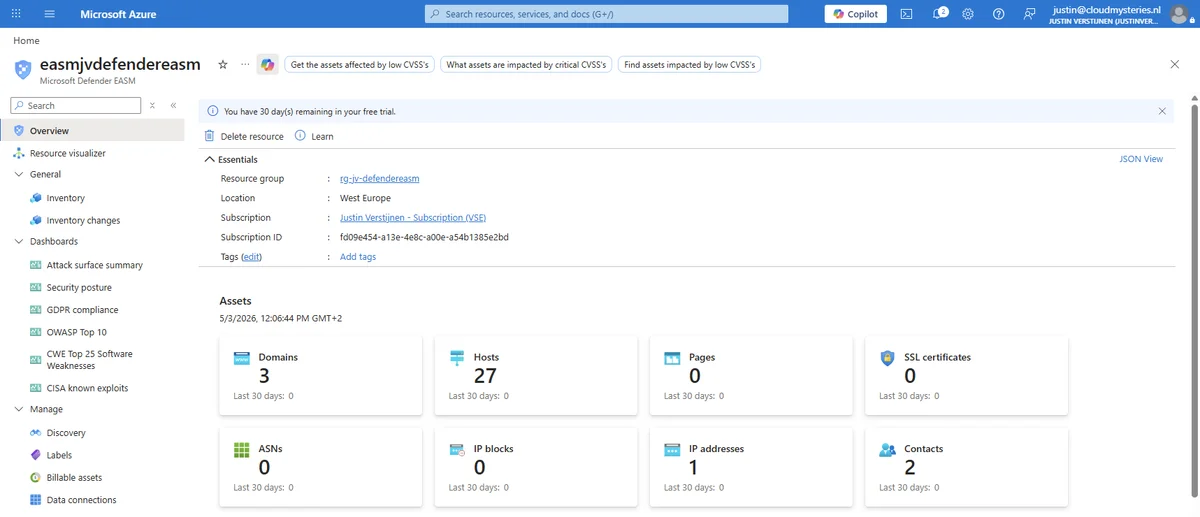
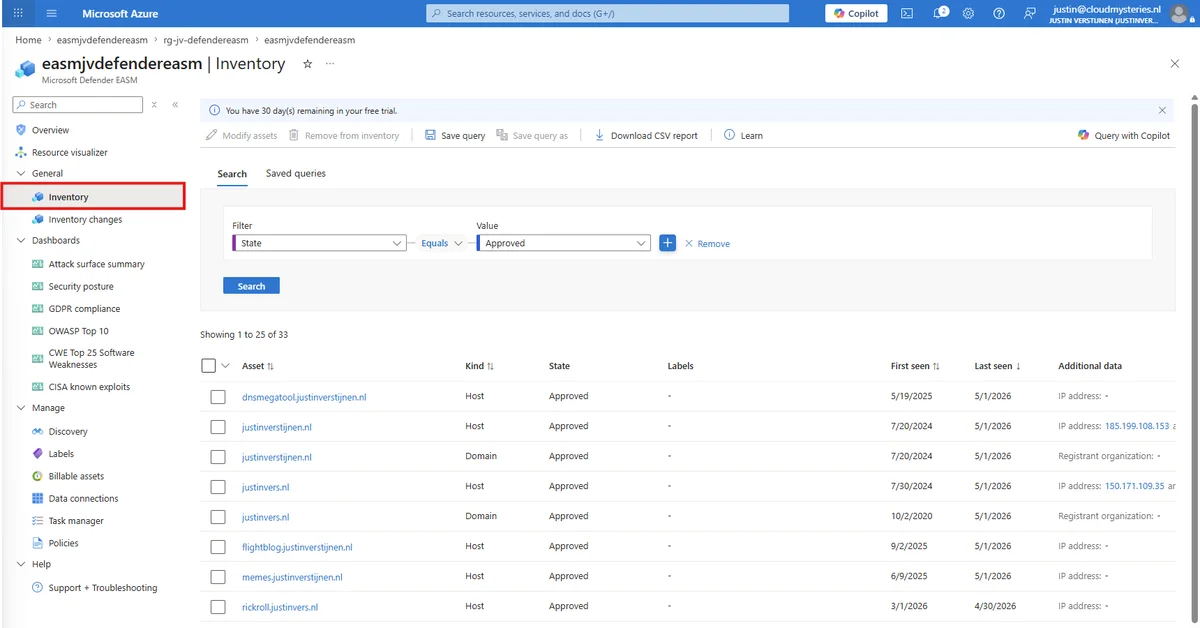
The Inventory panel lists all identified assets with their classification:
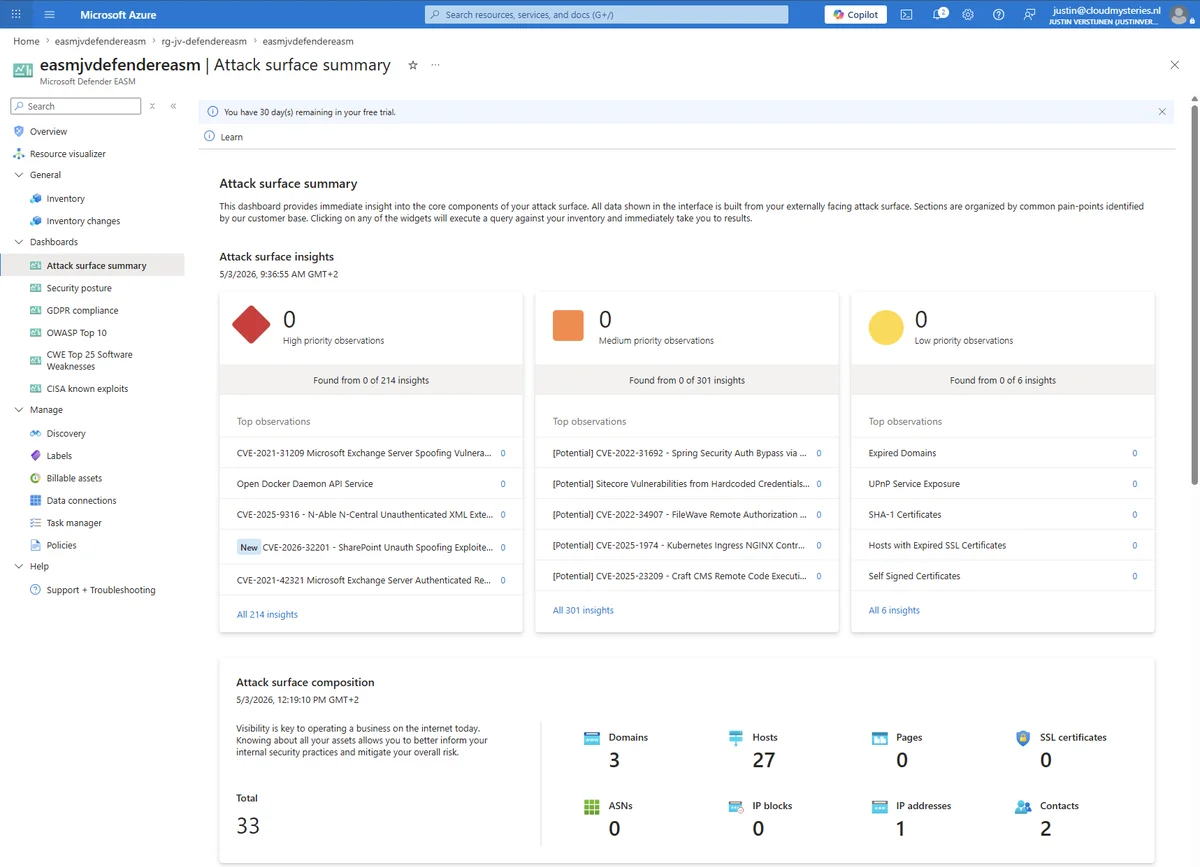
For a risk-oriented view, go to Dashboards > Attack surface summary. This dashboard groups exposures by category (critical CVEs, exposed sensitive ports, expiring certificates, etc.).
Step 4 — Add Additional Assets After Initial Discovery
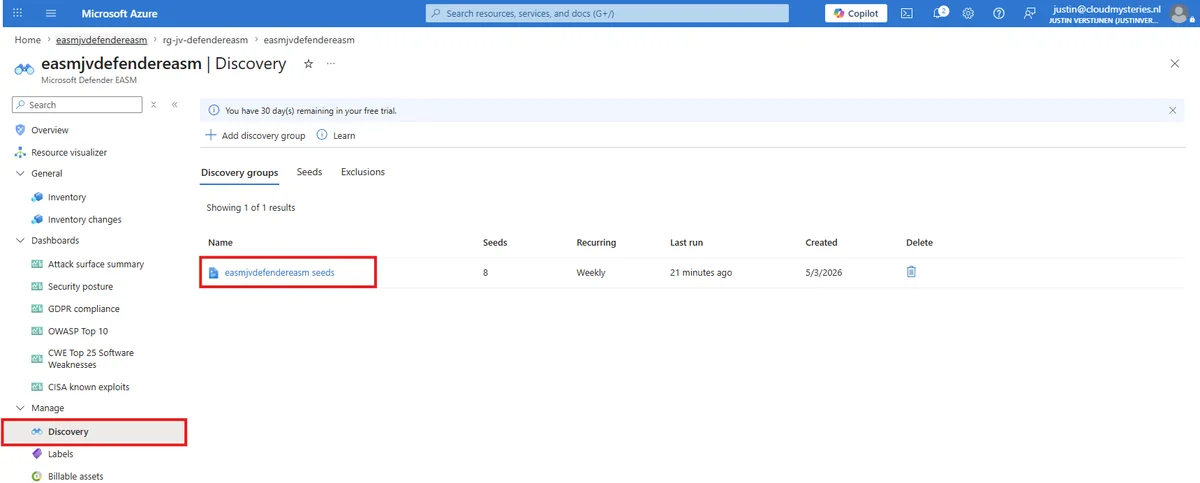
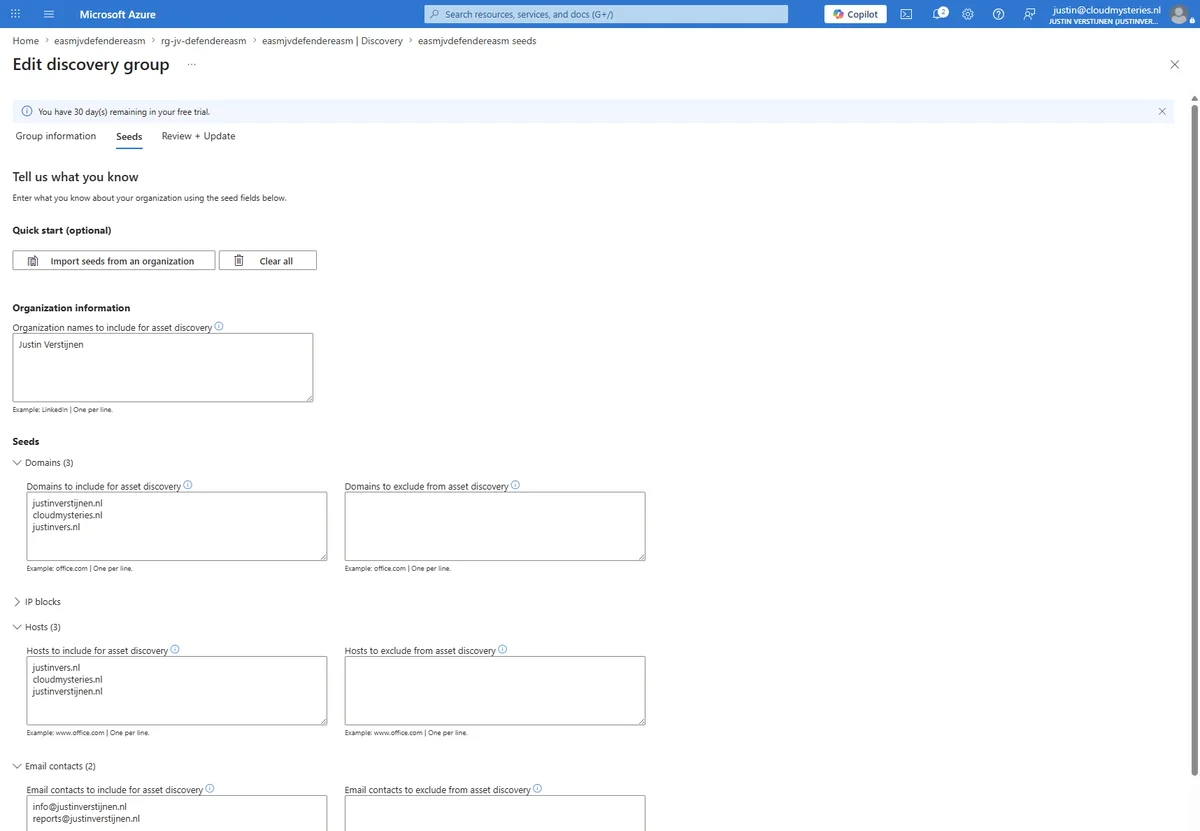
The inventory is not fixed. To enrich the monitored perimeter after initial deployment, go to Discovery, open the existing discovery group, then click Edit.
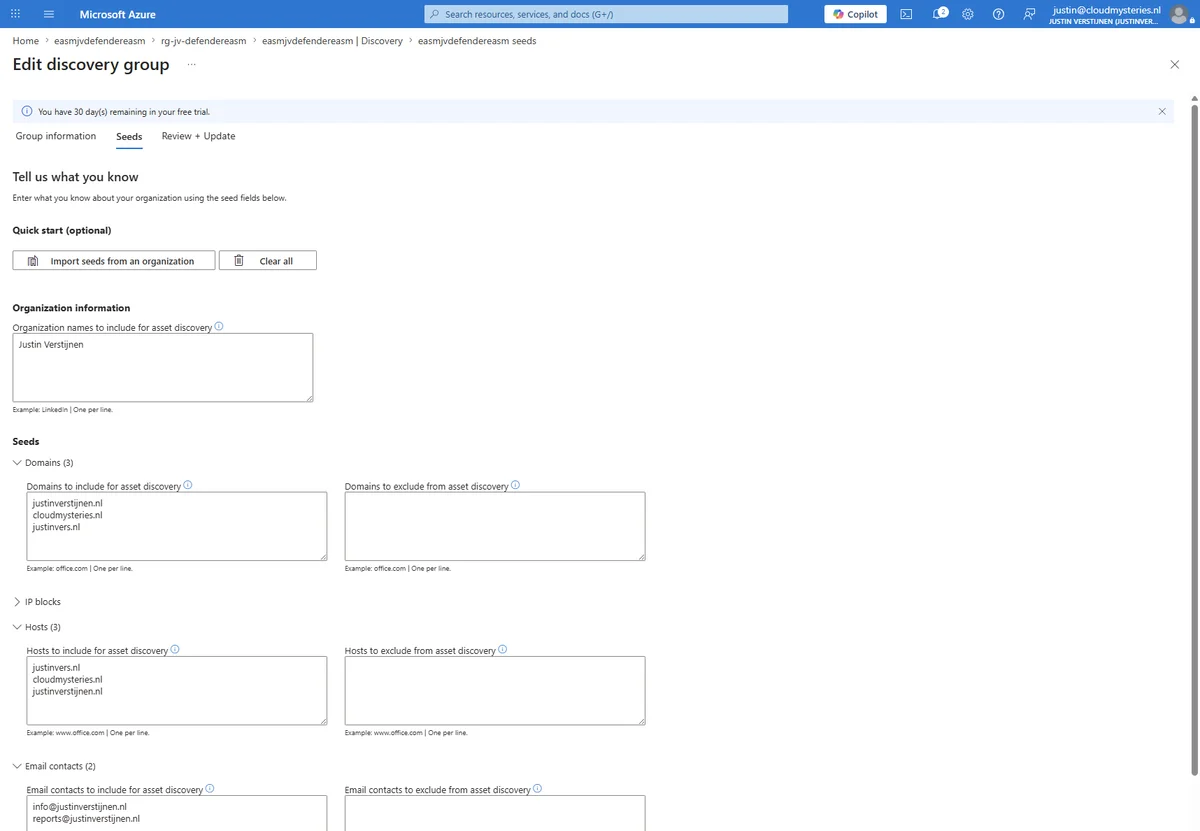
You'll find the same fields as during initial configuration. Add your new entries and save — a new scan cycle triggers automatically.
Validation Test with an Intentionally Vulnerable Target
To validate detection capabilities, it's useful to test EASM against a deliberately vulnerable asset. The Damn Vulnerable Web App image available on the Azure Marketplace serves as an ideal honeypot for this purpose.
Mandatory Network Isolation
Never deploy an intentionally vulnerable image like Damn Vulnerable Web App on a production network or connected to your business resources. Use an isolated virtual network, without peering, with a restrictive NSG. Delete the VM once testing is complete.
The test procedure is as follows:
- Deploy the vulnerable VM in an isolated VNet with a dedicated public IP
- Create an A record DNS pointing to this IP
- Add the IP and DNS name to your EASM inventory
- Wait for the scan to complete and analyze results

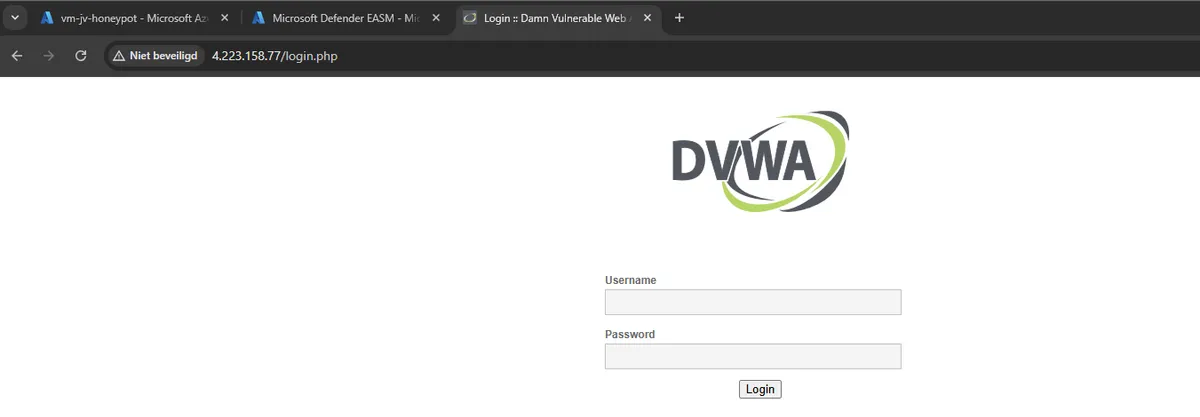
EASM correctly reports open ports, exposed services, and associated known vulnerabilities:
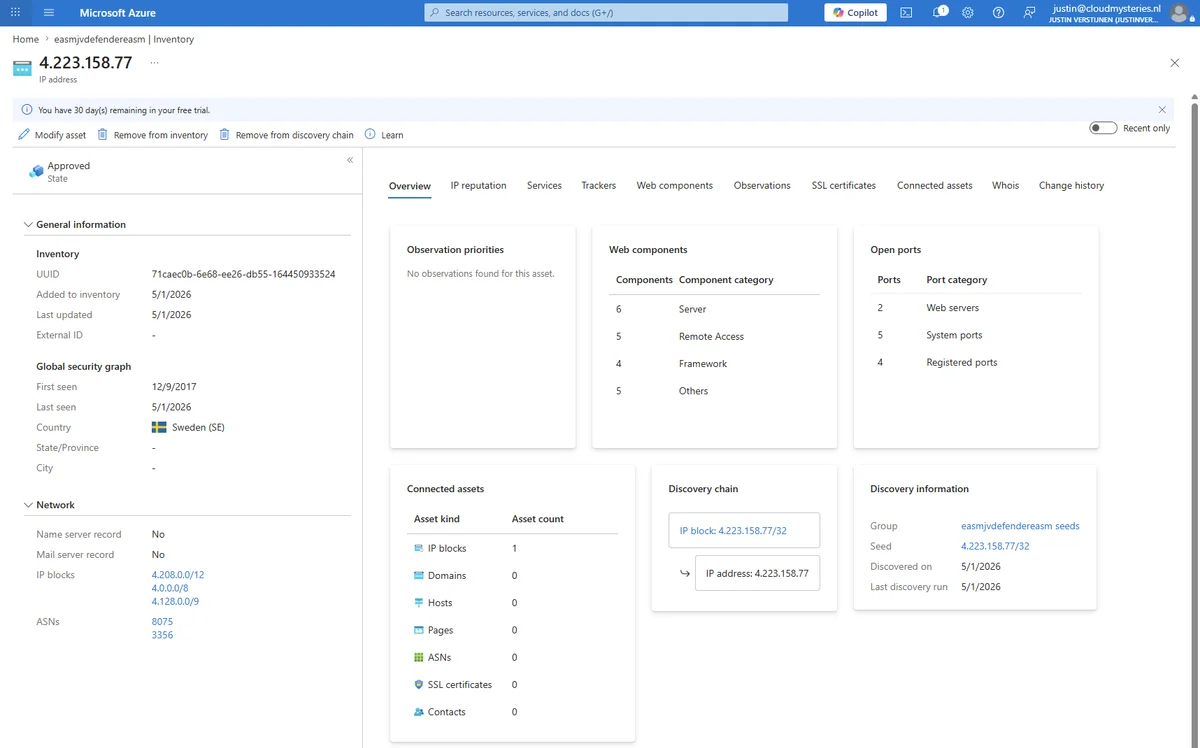
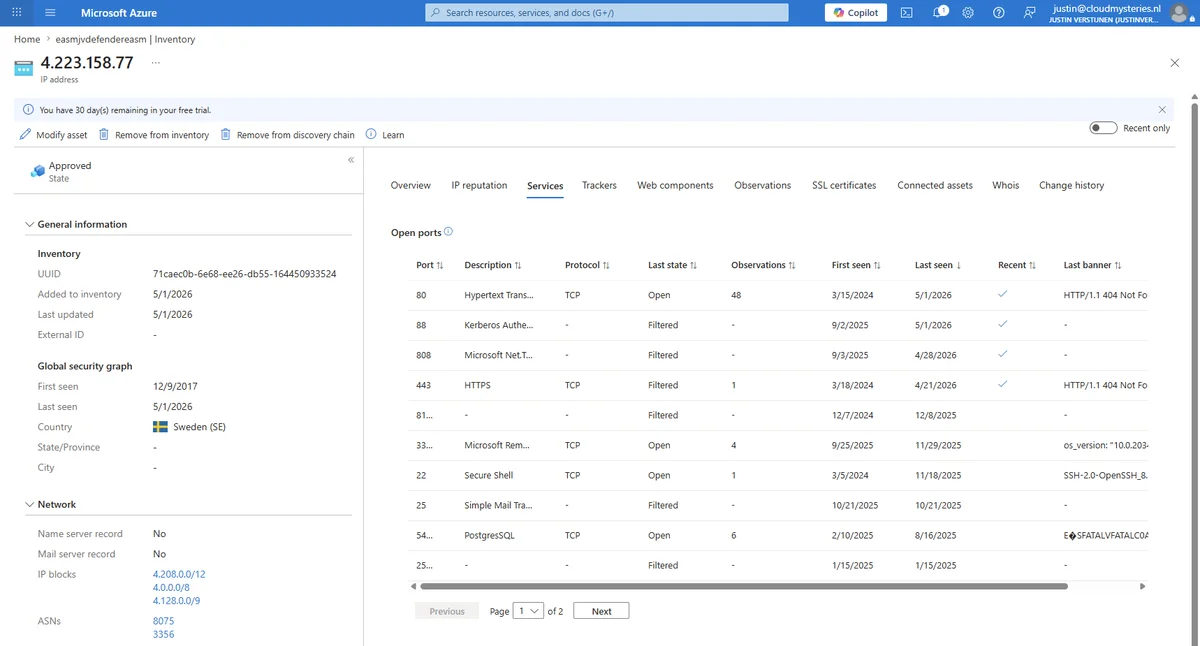
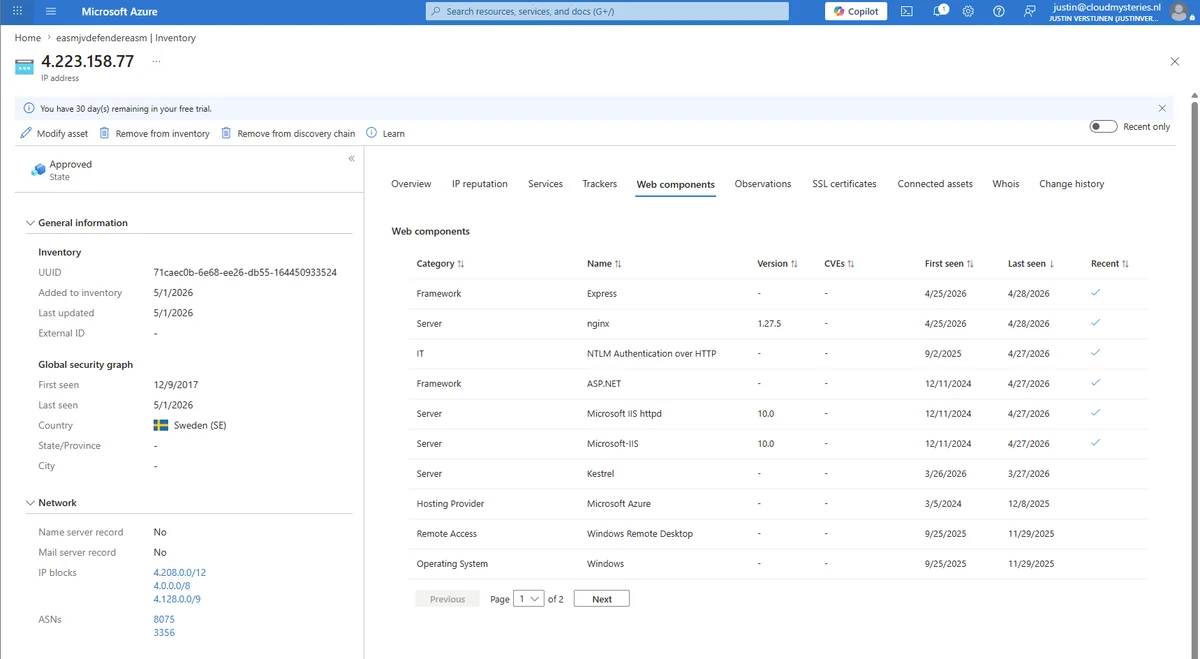
The result confirms that the solution correctly identifies exposed dangerous ports and corresponding CVEs — exactly what you expect from an EASM tool.
Integration with Microsoft Sentinel
To centralize EASM alerts in your SIEM, configure log export to a Log Analytics workspace linked to Microsoft Sentinel. Here's how to enable diagnostic settings from PowerShell:
1# Prerequisites: Az.Monitor >= 4.0 and Az.SecurityInsights modules2# Required role: Contributor on EASM resource + Microsoft Sentinel Contributor on LA workspace3 4$easmResourceId = "/subscriptions/<subscription-id>/resourceGroups/<rg-name>/providers/Microsoft.Easm/workspaces/<easm-workspace-name>"5$logAnalyticsWorkspaceId = "/subscriptions/<subscription-id>/resourceGroups/<rg-name>/providers/Microsoft.OperationalInsights/workspaces/<law-name>"6 7# Enable EASM log export to Log Analytics8Set-AzDiagnosticSetting `9 -ResourceId $easmResourceId `10 -WorkspaceId $logAnalyticsWorkspaceId `11 -Enabled $true `12 -Name "easm-to-sentinel" `13 -Category @("EasmAssetInsight", "EasmRequestLogs")Once logs are ingested, you can query them from Log Analytics with KQL:
1// List EASM assets with detected critical vulnerabilities2EasmAssetInsight_CL3| where TimeGenerated > ago(24h)4| where CvssScore_d >= 7.05| project TimeGenerated, AssetName_s, AssetType_s, CvssScore_d, CveName_s6| order by CvssScore_d descSentinel Analytic Rules
Create a Sentinel analytic rule triggered when an EASM asset presents a new CVE with a CVSS score above 9.0 (critical). Associate it with a Logic Apps playbook to automatically notify the SOC team via Teams or email.
Troubleshooting Common Errors
Not all providers are deployed in all Azure regions. Consult the list of supported regions in the official documentation. If your primary region is not listed, select the geographically closest region compatible with your data residency requirements.
Verify that the entered asset is indeed accessible from the Internet (public DNS resolution, routable IP). Assets behind a WAF with scanner blocking can prolong or block the cycle. Also check service quotas: too many assets added simultaneously can slow the processing queue.
The Reader role alone does not allow resource creation. Ensure you have the Contributor role or a custom role including Microsoft.Easm/workspaces/write on the target resource group. Verify with:
1Get-AzRoleAssignment -SignInName (Get-AzContext).Account.Id | Where-Object { $_.Scope -like "*<rg-name>*" }First verify that the diagnostic setting is properly enabled (Get-AzDiagnosticSetting -ResourceId $easmResourceId). Then wait up to 15 minutes for first ingestion. If logs are still absent after 30 minutes, confirm that the target Log Analytics workspace is properly associated with Sentinel and that the EasmAssetInsight_CL table has been created (it appears after first ingestion).
Official References
- Microsoft Defender EASM Documentation
- Defender EASM Pricing
- EASM Integration with Microsoft Sentinel
- OWASP Best Practices Referenced by EASM
- Managing Azure Resource Providers
Active Security Posture
Deploying Defender EASM is not an end in itself. Real value materializes when results feed into a structured remediation process: prioritization by CVSS score, remediation tickets assigned to responsible teams, and closure verification after the next scan cycle.