Introduction: The Challenge of Modern Application Monitoring
A modern cloud application is rarely monolithic. It relies on a constellation of interconnected Azure resources — managed services, containers, databases, caches, third-party APIs — each generating its own metrics, logs, and traces. When you add up these signals across a complete application, you can quickly find yourself facing thousands of indicators to analyze simultaneously.
This complexity makes incident detection and diagnosis particularly difficult: an operator facing an alert must mentally reconstruct the chain of dependencies before even being able to identify the root cause. It is precisely to address this challenge that Azure Health Models was designed.
What is Azure Health Models?
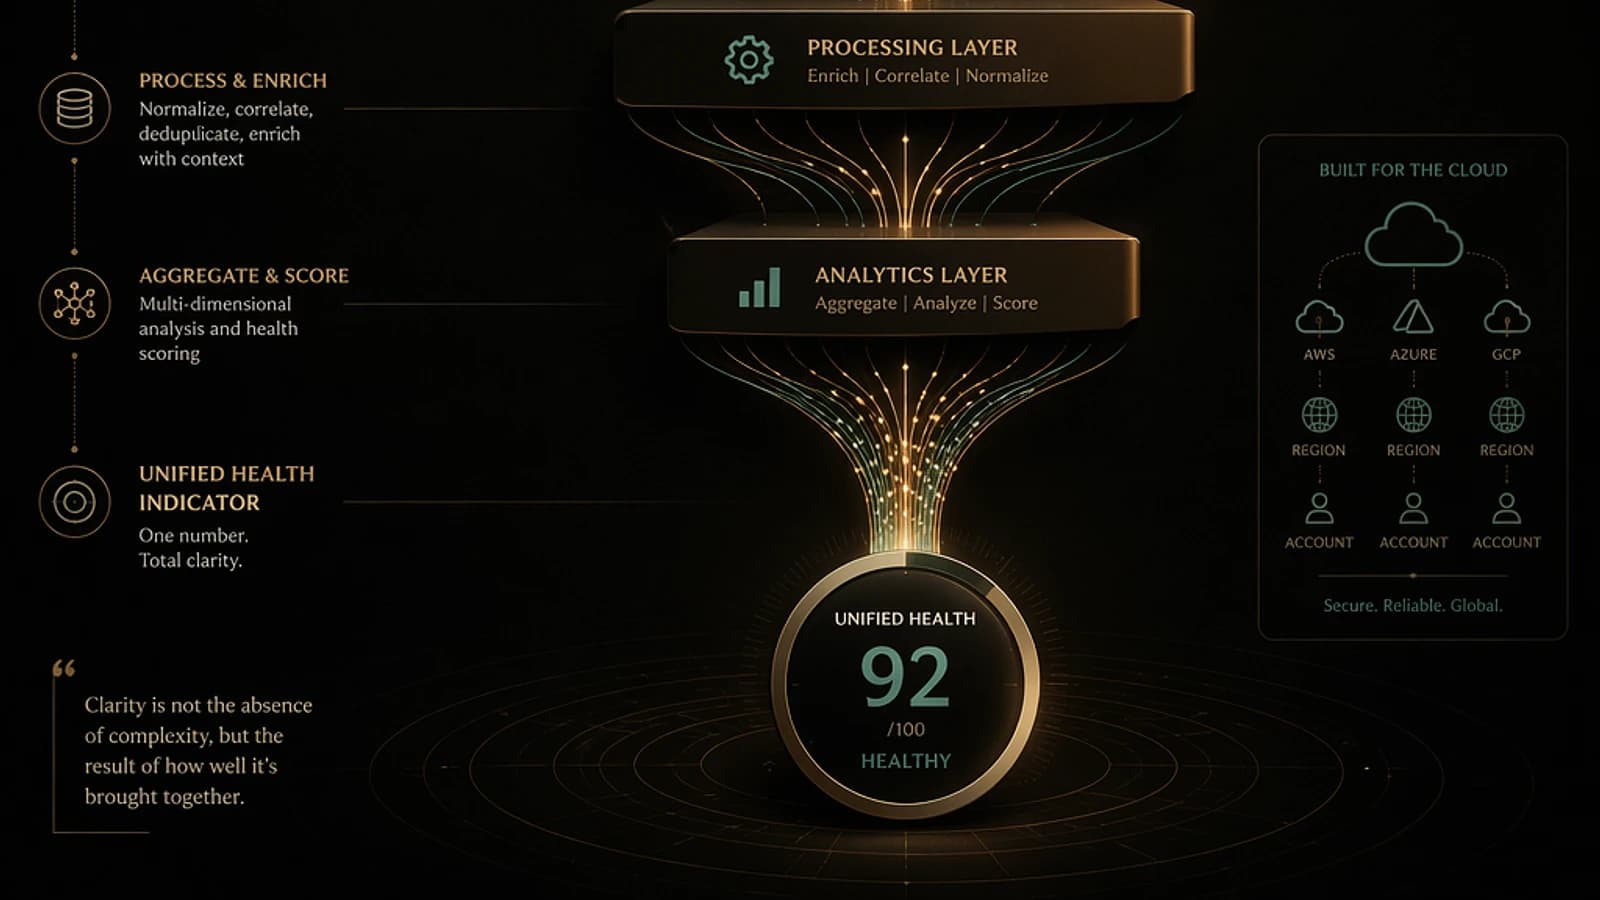
Azure Health Models is an Azure Monitor feature that allows you to model an application's health as a hierarchy, by aggregating signals from multiple sources (Azure Monitor metrics, Log Analytics, Application Insights, Prometheus) into a single, contextualized health indicator.
Signal Sources Supported by Azure Health Models
Before addressing the modeling itself, it is important to understand the richness of exploitable data sources. Azure Health Models is not limited to native Azure Monitor metrics; it aggregates signals from:
- Azure Monitor Metrics: native time-series metrics for each Azure resource (CPU, memory, latency, availability…)
- Log Analytics Workspaces: custom KQL (Kusto Query Language) queries to extract health states from your logs
- Application Insights: application telemetry (error rates, response times, dependency availability)
- Azure Monitor Managed Service for Prometheus: metrics from Kubernetes clusters, whether hosted on Azure or elsewhere
- External Sources: any service that can send data to Log Analytics can potentially be integrated into the model
This openness is fundamental: it means that a health model can cover hybrid or multi-cloud architectures, not just pure Azure resources.
KQL Tip
If you already master KQL queries in Log Analytics or Application Insights, you can reuse them directly to define the health signals of your components. No need to recreate queries from scratch.
Hierarchical Architecture: The Core of the Health Model
The Health Cascade Principle
The fundamental value of Azure Health Models rests on its hierarchical structure. The health of a parent element is derived from the health of its child dependencies. If a low-level component becomes unhealthy, the impact automatically propagates upward through the hierarchy.
This propagation allows an operations team to understand at a glance:
- What is the overall state of the application?
- Which business function is impacted?
- Which technical component is at the origin of the problem?
The Four Levels of the Hierarchy
| Level | Description | Example |
|---|---|---|
| Model (business entity) | Represents the application or service in its entirety | E-commerce application |
| Business functions | Major functional capabilities of the application | Shop, User Management, Administration |
| Application components | Technical subsystems serving business functions | Navigation, Shopping Cart, Payment, Search |
| Platform resources | Underlying Azure resources and infrastructure services | Azure Cache for Redis, Key Vault, App Service |
Concrete Example: An E-commerce Application
Let's take the example of an online sales application to illustrate the structuring of a health model:
- Level 1 (Model): The e-commerce application as a whole
- Level 2 (Business Functions): Shop, User Management, Shop Administration
- Level 3 (Application Components): Product Navigation, Add to Cart, Payment Process, Search Engine
- Level 4 (Platform Resources): App Service instances, Azure Cache for Redis, Azure Key Vault, databases
Note that the same application component can be shared between multiple business functions. For example, the frontend can be a dependency for both navigation and the payment process.
Configuring Health Aggregation Rules
One of the key points of flexibility in Azure Health Models concerns the health aggregation logic between dependencies. Two main modes are available:
"Worst-of" Mode (Most Unfavorable)
This is the default behavior. If a single dependency is in Unhealthy state, the parent component is also considered Unhealthy. This mode is suitable for architectures without redundancy, where each component is critical.
"Fleet" Mode (Availability Threshold)
For redundant architectures (clusters, resource pools, availability groups), you can define:
- A minimum number of healthy dependencies required for the parent to remain healthy
- A maximum number of failed dependencies tolerated before declaring a Degraded or Unhealthy state
Choose the Right Aggregation Mode
A poor choice of aggregation mode can generate false positives (unnecessary alerts) or false negatives (undetected incidents). Always align the aggregation mode with the actual redundancy architecture of your components.
Demonstration: Navigating the Dashboard
The Azure Health Models dashboard offers an interactive graphical view of your hierarchy. Here's what you'll find in practice:
- Overview: visual representation of all hierarchy nodes, colored by their state (green = Healthy, orange = Degraded, red = Unhealthy)
- Health Timeline: history of each node's state over time, allowing you to analyze the duration and progression of incidents
- Signal Details: for each resource, list of metrics and KQL queries used to evaluate the state, with the ability to explore them
- Visual Propagation: immediate identification of the element originating a degradation and its impact on upper levels
In the example of an e-commerce application, if the cache (Azure Cache for Redis) becomes unhealthy, the dashboard will immediately display the impact on the search function, then on the shop as a whole — while indicating that payment and user management remain operational.
Configuring an Azure Health Model: Step-by-Step Guide
Access the Azure Health Models Designer
In the Azure portal, navigate to Azure Monitor then access the Health Models section. Click on Create to open the visual design interface (the Designer).
Official Reference: Azure Monitor Health Models - Microsoft Documentation
Add Entities and Resources
In the Designer, start by defining high-level entities (model, business functions), then add application components and finally underlying Azure resources. You can:
- Use Add Entity to create logical nodes (functions, components)
- Use Add Azure Resource to link existing Azure resources (App Service, Redis Cache, Key Vault…)
Define Dependency Relationships
Once entities are created, establish parent-child relationships by drag-and-drop in the graphical interface. Each dependency link defines how health propagates up the hierarchy.
Configure Health Signals
For each resource or component, define the signals used to evaluate health state. Configuration examples:
1// Example KQL query to detect high error rate2requests3| where timestamp > ago(5m)4| summarize errorRate = countif(success == false) * 100.0 / count()5| where errorRate > 5You can combine native Azure Monitor metrics and custom KQL queries for each signal.
Configure the Aggregation Mode
For each parent node, select the aggregation mode suited to your architecture:
- Worst-of: a single unhealthy child is enough to degrade the parent
- Fleet: define a minimum threshold of healthy dependencies
Configure Alerts and Action Groups
Define alerts on Degraded and Unhealthy states for critical nodes in your hierarchy. Associate each alert with an Azure Monitor Action Group to trigger appropriate actions:
- Send email or SMS
- Call a webhook (ITSM integration, PagerDuty, Slack…)
- Trigger an Azure Function for automated remediation
- Notification via Azure Logic Apps
Reference: Action Groups in Azure Monitor
Model Composition and Reuse
Azure Health Models supports model composition. An existing model can be referenced as a dependency in another model. This approach allows you to:
- Reuse models of shared services (for example, a user authentication service model used by multiple applications)
- Delegate responsibility for certain models to different teams
- Reduce complexity by decomposing a large system into coherent sub-models
Best Practice for Organization
For organizations with many applications, consider creating dedicated models for shared infrastructure services (network layer, identity services, observability) that you can then reference in application models.
Operational Benefits for IT Teams
Adopting Azure Health Models brings concrete benefits to operations and development teams:
- MTTR Reduction (Mean Time To Resolve): the visual hierarchy accelerates root cause identification
- Better Business Communication: health state is expressed in terms of functionalities ("payment is unavailable") rather than technical metrics
- Contextualized Alerting: alerts are issued at the relevant functional level, reducing noise and false positives
- Reuse of Existing Investments: KQL queries, metrics, and Log Analytics workspaces already in place are directly exploitable
- End-to-End Visibility: a single view covers the entire chain, from infrastructure resources to business functions
Resources and Additional References
To deepen your mastery of Azure Health Models and the Azure Monitor ecosystem:
- Official Azure Monitor Health Models Documentation
- KQL Reference for Azure Monitor
- Azure Monitor Action Groups
- Azure Managed Prometheus
- Application Insights - Overview
Availability
Azure Health Models is available in the Azure portal via Azure Monitor. Check availability in your region and any subscription requirements on the official Microsoft Learn page.
Conclusion
Azure Health Models represents a significant evolution in application monitoring on Azure. By transforming thousands of raw signals into a readable and actionable health hierarchy, it enables IT teams to move from reactive monitoring based on isolated metrics to service and business function-oriented observability.
Whether you manage an e-commerce application, an ERP system, or a SaaS platform, health modeling helps you quickly answer the essential question: what's not working, and what impact does it have on my users?