
Introduction to SharePoint API Usage Report
Microsoft recently introduced in the Microsoft Graph API changelog a new reporting endpoint dedicated to SharePoint Online: the SharePoint API Usage Report. Available only under the /beta endpoint, this report provides administrators with granular visibility into SharePoint API consumption by applications registered in their Azure AD tenant.
This article guides you step-by-step through activating the report, understanding its data, and programmatically leveraging its endpoints via PowerShell and Graph Explorer. It is intended for cloud engineers and Microsoft 365 administrators who wish to instrument their governance of SharePoint API access.
Preview Status
This report is currently in public preview and only accessible via the /beta endpoint of Microsoft Graph. It should not be used in production without prior validation. Response schemas and permissions may change without notice.
Why This Report Is Strategic for Your Tenant
Before the introduction of this report, monitoring API consumption on SharePoint Online relied essentially on Unified Audit Logs and aggregated data from the Microsoft 365 admin portal. While useful, these sources did not allow for easily identifying which application consumes the most bandwidth or performs the most API requests over a given period.
The SharePoint API Usage Report fills this gap by exposing precise metrics by application, by day, including:
- The volume of data transferred (in MB)
- The number of API operations executed
- Identification of each application by its Azure AD
AppId
This information is valuable for the following scenarios:
- Governance audit: identify over-consuming third-party or internal applications
- Performance optimization: detect abnormal consumption patterns
- Capacity planning: anticipate peaks in SharePoint API load
- Security: identify unknown applications with active API access
Complementarity with the Graph API Usage Report
This report is designed on the same model as the Graph API Usage Report (endpoint getGraphApiUsage). If you already manage the latter, onboarding will be straightforward. The two reports are complementary and should be analyzed jointly for a 360° view of API consumption in your tenant.
Technical Requirements and Permissions Model
Microsoft Graph Permissions Required
The report currently works exclusively in delegated mode (Delegated permissions). Application permissions are not yet supported according to official Microsoft documentation.
Application Permissions Not Supported
Despite what the documentation indicates, tests have shown that endpoints do not strictly enforce required permissions in all cases. Nevertheless, follow official recommendations closely to avoid unexpected behavior when the API is updated.
Here is a table of required permissions by operation:
| Operation | Endpoint | Required Permission | Type |
|---|---|---|---|
| Enable collection | POST enableApiUsageReport | ReportSettings.ReadWrite.All | Delegated |
| Check status | GET apiUsageReportMetrics | ReportSettings.Read.All | Delegated |
| Read report | GET getSharePointApiUsage | Reports.Read.All | Delegated |
Recommended Azure AD Roles
- Global Administrator: for initial activation of collection
- Reports Reader: for reading report data (principle of least privilege)
- SharePoint Administrator: access to advanced SharePoint settings
Activating the SharePoint API Usage Report
Activating the report requires two distinct steps: sending an activation request, then verifying the integration status.
Send activation request via Graph API
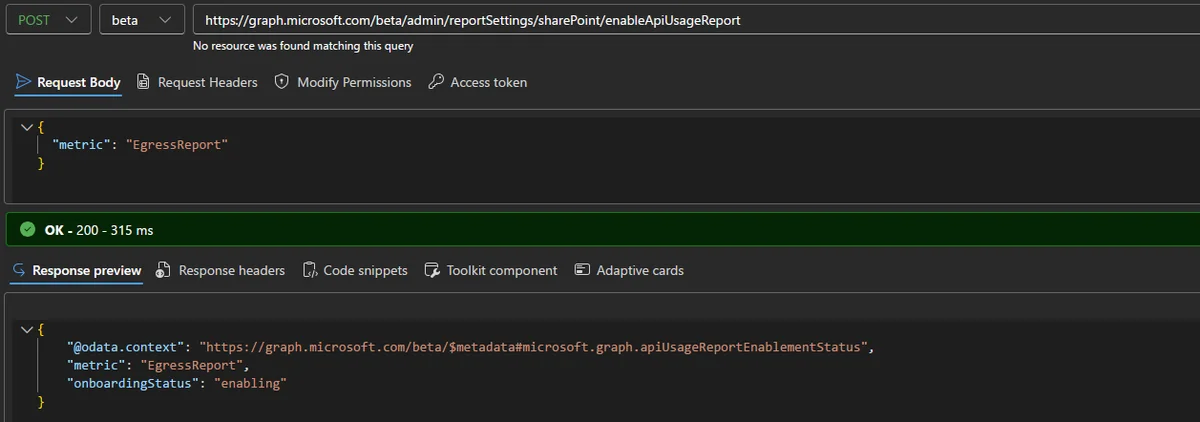
Issue a POST request against the enableApiUsageReport endpoint with the following JSON payload. This operation enables metrics collection for the EgressReport metric:
1POST https://graph.microsoft.com/beta/admin/reportSettings/sharePoint/enableApiUsageReport2Content-Type: application/json3 4{5 "metric": "EgressReport"6}A 200 OK response indicates that the request has been accepted. The returned onboardingStatus field then takes the value enabling, meaning that data collection is being initialized on the Microsoft infrastructure side.
Check integration status
After activation, query the apiUsageReportMetrics endpoint to track status progress:
1GET https://graph.microsoft.com/beta/admin/reportSettings/sharePoint/apiUsageReportMetricsThe expected JSON response looks like:
1{2 "@odata.context": "https://graph.microsoft.com/beta/$metadata#admin/reportSettings/sharePoint/apiUsageReportMetrics",3 "metric": "EgressReport",4 "onboardingStatus": "enabled",5 "lastUpdatedDateTime": "2026-07-01T00:00:00Z"6}Wait for the status to change from enabling to enabled before attempting to retrieve report data.
Wait for initialization period
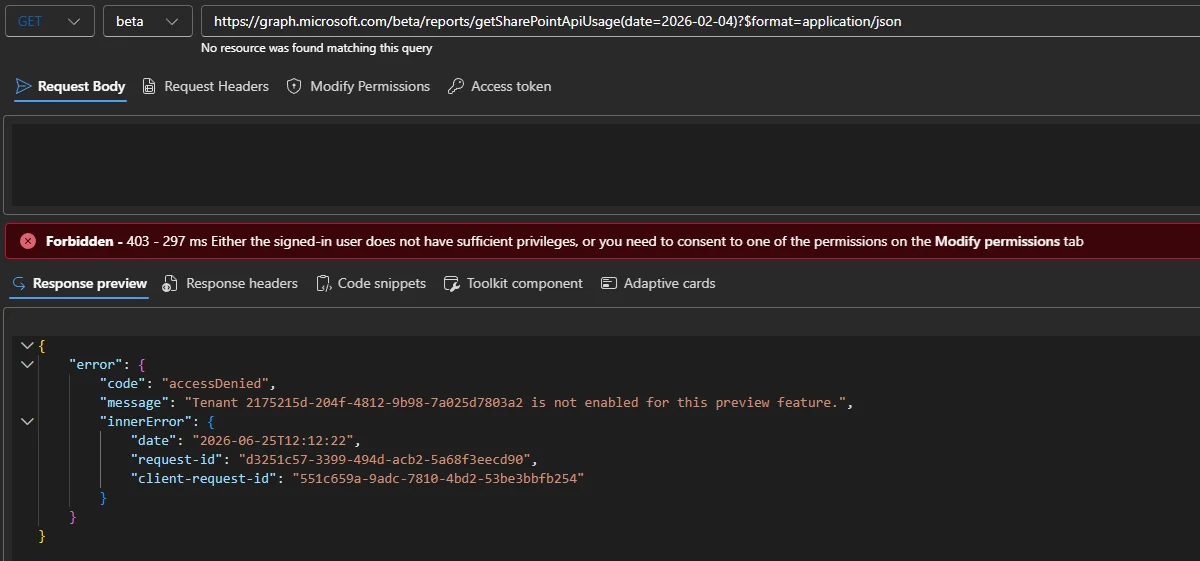
Report data is generated on a daily basis. It is recommended to wait at least 48 to 72 hours after activation before querying the report. During this period, any request to the getSharePointApiUsage endpoint will return a 403 Forbidden error.
PowerShell Implementation with Microsoft.Graph SDK
Here is a complete PowerShell script to automate the activation and retrieval of report data. It uses the Microsoft.Graph PowerShell SDK module.
Installation of Required Module
1# Installation of Microsoft Graph PowerShell SDK module2Install-Module -Name Microsoft.Graph -Scope CurrentUser -ForceReport Activation Script
1# Connection with required delegated scopes2Connect-MgGraph -Scopes "ReportSettings.ReadWrite.All", "Reports.Read.All"3 4# Activation of SharePoint API Usage metrics collection5$enableBody = @{6 metric = "EgressReport"7} | ConvertTo-Json8 9try {10 $enableResponse = Invoke-MgGraphRequest `11 -Method POST `12 -Uri "https://graph.microsoft.com/beta/admin/reportSettings/sharePoint/enableApiUsageReport" `13 -Body $enableBody `14 -ContentType "application/json"15 16 Write-Host "[OK] Collection enabled. Status: $($enableResponse.onboardingStatus)" -ForegroundColor Green17} catch {18 Write-Error "Error during activation: $($_.Exception.Message)"19}20 21# Verification of integration status22$statusResponse = Invoke-MgGraphRequest `23 -Method GET `24 -Uri "https://graph.microsoft.com/beta/admin/reportSettings/sharePoint/apiUsageReportMetrics"25 26Write-Host "Current status: $($statusResponse.onboardingStatus)"27Write-Host "Last update: $($statusResponse.lastUpdatedDateTime)"Report Retrieval and Analysis Script
1# Configurable parameters2$period = "D30" # Possible values: D1, D7, D303$outputPath = "C:\Reports\SharePointAPIUsage_$(Get-Date -Format 'yyyyMMdd').csv"4 5# Connection6Connect-MgGraph -Scopes "Reports.Read.All"7 8try {9 # Retrieve report data10 $reportData = Invoke-MgGraphRequest `11 -Method GET `12 -Uri "https://graph.microsoft.com/beta/reports/getSharePointApiUsage(period='$period')"13 14 # Check for data presence15 if ($null -eq $reportData.value -or $reportData.value.Count -eq 0) {16 Write-Warning "No data available. Verify that collection is enabled and initialization delay has passed."17 exit18 }19 20 # Transform and export to CSV21 $report = $reportData.value | Select-Object `22 @{N="Date"; E={$_.usageDateTime}},23 @{N="ServiceArea"; E={$_.serviceArea}},24 @{N="AppId"; E={$_.appId}},25 @{N="UsageMB"; E={[math]::Round($_.usageMB, 2)}},26 @{N="UsageRequests"; E={$_.usageRequests}}27 28 $report | Export-Csv -Path $outputPath -NoTypeInformation -Encoding UTF829 Write-Host "[OK] Report exported: $outputPath" -ForegroundColor Green30 31 # Analysis: Top 10 applications by consumption (MB)32 Write-Host "`n=== Top 10 Applications by Consumption MB ==="33 $report | Group-Object -Property AppId | `34 Select-Object Name, @{N="TotalMB"; E={($_.Group | Measure-Object UsageMB -Sum).Sum}} | `35 Sort-Object TotalMB -Descending | `36 Select-Object -First 10 | `37 Format-Table -AutoSize38 39} catch {40 Write-Error "Error retrieving report: $($_.Exception.Message)"41}Filtering by AppId
To monitor a specific application, add the appId filter parameter directly to the request URL:
https://graph.microsoft.com/beta/reports/getSharePointApiUsage(period='D30')?appId='972bb84a-1d27-4bd3-8306-6b8e57679e8c'
This allows you to target, for example, Microsoft Defender for Cloud Apps (972bb84a-1d27-4bd3-8306-6b8e57679e8c) or any other registered application.
Report Data Analysis
Structure of Returned Data
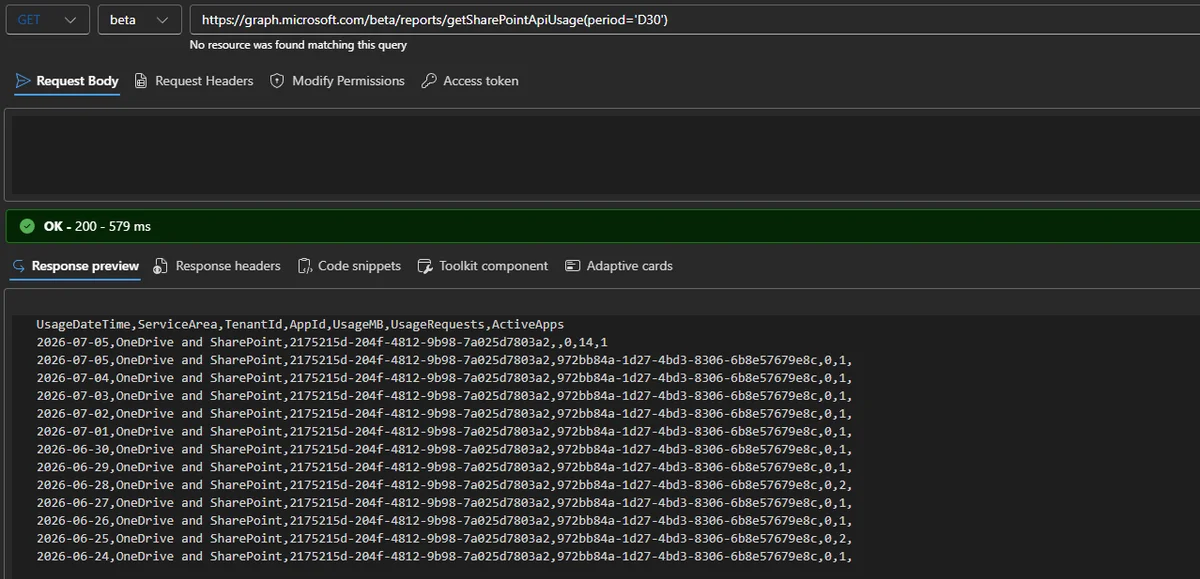
The getSharePointApiUsage endpoint returns by default a JSON payload with the following annotated structure:
1{2 "@odata.context": "https://graph.microsoft.com/beta/$metadata#Collection(microsoft.graph.sharePointApiUsage)",3 "value": [4 {5 "usageDateTime": "2026-06-30",6 "serviceArea": "SharePoint",7 "tenantId": "xxxxxxxx-xxxx-xxxx-xxxx-xxxxxxxxxxxx",8 "appId": "yyyyyyyy-yyyy-yyyy-yyyy-yyyyyyyyyyyy",9 "usageMB": 1245.67,10 "usageRequests": 98432,11 "activeApps": null12 }13 ]14}Detailed Field Description
usageDateTime: Report period date (daily granularity, ISO 8601 format)serviceArea: Service area concerned — currentlySharePointtenantId: GUID of the tenant — redundant if querying your own tenantappId: GUID of the Azure AD application that made SharePoint API callsusageMB: Volume of data transferred in megabytes for the dayusageRequests: Total number of API operations performed by the application for the dayactiveApps: Documented field but not yet returned — will eventually indicate the number of unique active applications over the period
Supported Query Parameters
| Parameter | Syntax | Description | Example |
|---|---|---|---|
| period | period='Dx' | Data period: D1, D7, D30 | period='D7' |
| date | date=YYYY-MM-DD | Data for a specific date | date=2026-06-15 |
| appId | appId='GUID' | Filtering by application | appId='972bb84a-...' |
| $format | $format=json | Output format (JSON by default) | $format=json |
Do Not Modify the $format Parameter
Although the endpoint supports the $format parameter, use it only with the json value. Other values such as csv or text/csv may produce inconsistent results or errors in preview environment.
Architecture and Governance Considerations
Positioning in the Microsoft Graph Ecosystem
The SharePoint API Usage Report is part of the Microsoft Graph usage reports family, alongside:
getGraphApiUsage— global Microsoft Graph API consumptiongetSharePointActivityUserDetail— SharePoint user activitygetSharePointSiteUsageDetail— usage by SharePoint site
Unlike user activity reports, this new report focuses exclusively on application consumption of APIs, making it a complementary and non-substitutable governance tool.
Recommended Architecture for Data Collection
To industrialize the collection and analysis of this data, it is recommended to implement the following pipeline:
1[Azure Automation / Logic App]2 |3 v4[Graph API - getSharePointApiUsage]5 |6 v7[Azure Storage Account / Log Analytics Workspace]8 |9 v10[Power BI / Azure Workbooks]An Azure Automation Runbook scheduled daily can automate data collection and archiving in a Log Analytics Workspace, allowing subsequent analysis via KQL and alerts based on consumption thresholds.
Example KQL Query for Log Analytics
If you ingest data into Log Analytics via a Custom Log, here is a KQL query to identify the most consuming applications:
1SharePointApiUsage_CL2| where TimeGenerated >= ago(30d)3| summarize TotalMB = sum(usageMB_d), TotalRequests = sum(usageRequests_d) by appId_s4| top 10 by TotalMB desc5| project AppId = appId_s,6 TotalDataMB = round(TotalMB, 2),7 TotalAPIRequests = TotalRequests8| order by TotalDataMB descAnticipating Future Throttling Policies
Microsoft has not yet officially communicated on any potential throttling policies based on these metrics. However, the introduction of this report suggests an evolution toward a stricter governance model. It is advisable to start collecting and archiving this data now to establish consumption baselines that will serve as reference points during future negotiations with Microsoft or security investigations.
Known Limitations and Points of Attention
- Preview only: The
/betaendpoint may be modified or removed without notice by Microsoft - Delegated permissions exclusively: Lack of support for application permissions limits non-interactive automation
- Availability delay: Data is not available in real-time; they are generated daily with a potential delay of 24 to 72 hours
activeAppsfield non-functional: Documented but not returned in current responses- No configurable retention: The maximum queryable period is 30 days (
D30) - Graph API uniformity: The requirement to manually enable collection and the existence of a dedicated endpoint (rather than native integration into
getGraphApiUsage) reflects architectural fragmentation within Microsoft product teams
Official Reference Resources
- Microsoft Graph Documentation - enableApiUsageReport
- Microsoft Graph Documentation - getSharePointApiUsage
- Graph API Changelog
- Microsoft Graph PowerShell SDK
- Azure AD Roles for Microsoft 365 Reports
- Microsoft Graph Explorer
Conclusion
The SharePoint API Usage Report is a welcome addition to the Microsoft Graph reporting arsenal, especially for organizations with many third-party or internal applications integrated with SharePoint Online. Despite its current limitations — lack of application permissions, need for manual activation, non-real-time data — it offers previously non-existent visibility into API consumption at the application level.
Implementing automated collection and archiving in Log Analytics now will establish solid baselines and prepare for any throttling policies Microsoft might introduce in the future. This is a good governance practice that any serious SharePoint Online administrator should integrate into their monitoring toolset.